

The aim of the website is to show the results of analysis of OneGenE project.
The emphasis is on the differences between the co-expression networks based on Pearson
correlation vs the causal networks generated with OneGenE based on the Relative Frequency of association.
The main goal is the representation of a network that allows visualisation of the results and users' interactions to search and refine them.
The gene network can be identified as a graph where:
- Nodes are the genes
- Edges represent both OneGenE association and Pearson correlation.
Given the different nature of the edges, gene networks can be viewed as two graphs with common nodes: one undirected graph (Pearson correlation edges) and one directed graph (OneGenE Relative Frequency association edges).
The creation of a network requires few simple steps
Step 1 - Search
The first step consist in finding the the genes that will be the seeders of the network.
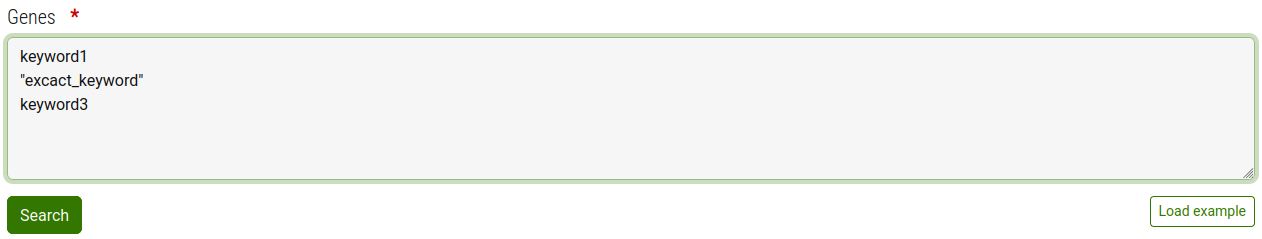
In the search form type one or more keywords each on a separate line.
- To specify an exact attribute value to search enclose it in in double quotes " es.:"gene_attribute_value"
- The search is case IN-sensitve.
When done press the search button
The system will then find all genes containing one or more keywords across all attributes of all available genes (All attributes and values are visibile in the "genes" section of each model).
Note: For performance reason the system has an internal limit on the maximun number of nodes that the search can return. Exeeding this limit will result in an error.
If you sohould encounter this error please refine your search terms.
Step 2 - Seeders selection
The result of the search in the previous step is a list of Genes that could be picked as seeder(s).
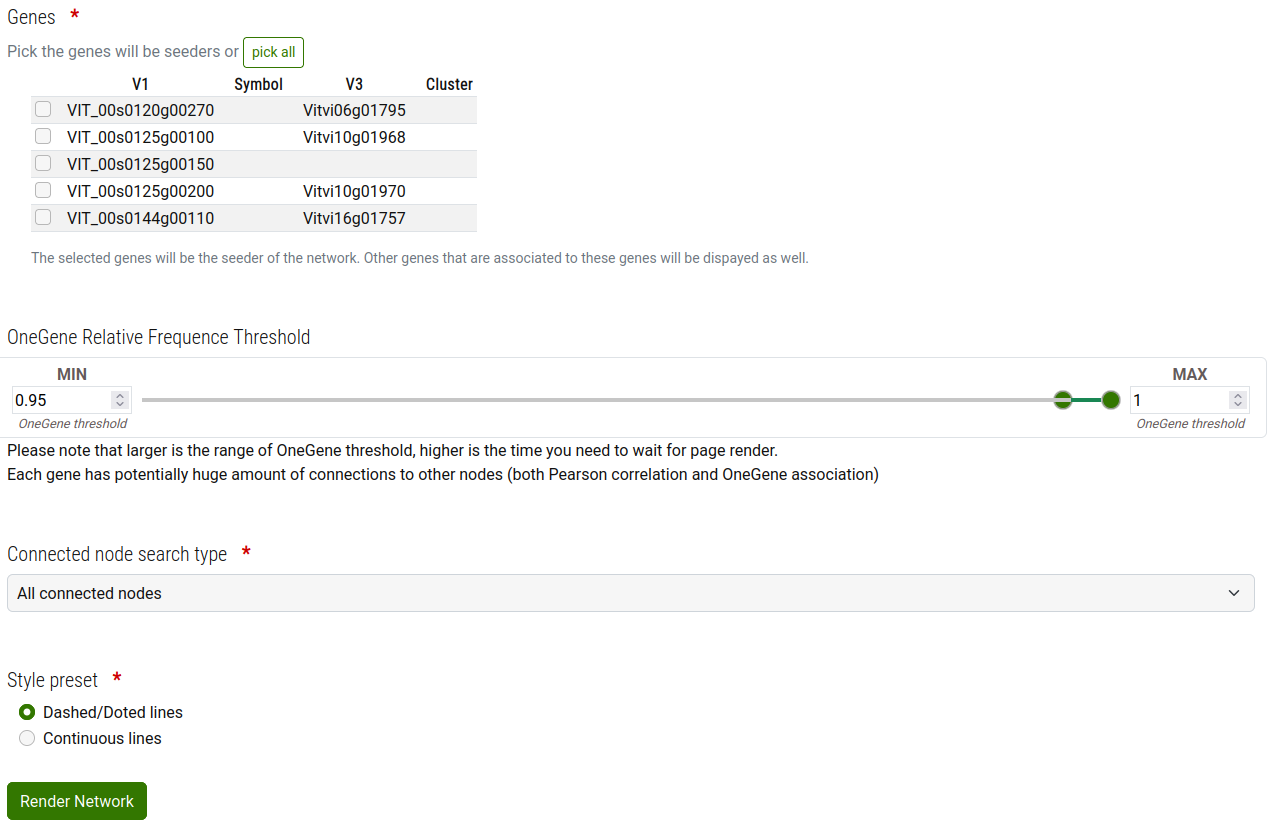
From the list of found genes, you must pick the seeders of the network (At least one is required).
Modify according to your needs the range of OneGenE Relative Frequence to consider.
Select the connected node search type that best fit your needs.
Here a brief explanation that explain how the network is build up based on the "node search type" option:
- Add the genes you have picked;
- Add the genes that are connected to the seeders with a OneGenE Relative Frequence in the range you have set in previous step. The genes added in this step are filtered in accordance to the "Connected node search type" selection, in particular:
- "All connected nodes": Add all nodes connected to the seeders
- "Only nodes shared between 2 or more seed nodes": Add only the nodes that are shared at least between two seeders
- "Only nodes shared between all seed nodes": Add only the nodes that are shared between all seeders
- "No connected nodes, use only seed nodes": No other nodes than the selected ones will be added in the results
- Add the OneGenE Relative Frequence association among the genes; only the association with a value in the range you have set in the previous step;
- Add the Pearson correlation among the genes.
Important: You should be aware that more genes you pick as seeders and larger range of OneGenE Relative Frequence association you set, the longer is the time required to build, show and interact with the network.
As in the previous step, for performance reason the system has an internal limit on the maximun number of nodes in the final graph. Exeeding this limit will result in an error.
Step 3 - Interacting with the editor
The network is draw and you can modify a plethora of aspects.
OneGenE threshold

- Show/hide all OneGenE edges
- Change the range of visibile OneGenE edges, based on their Relative Frequency value.
Note: the range minimum value is limited to the minumum value set in the previous setp
Pearson threshold

- Show/hide Pearson edges between nodes that have a OneGenE relation (Internal Pearson edge)
- Show/hide Pearson edges between nodes that does not have a OneGenE relation (External Pearson edge)
- Switch the filtering of visible Pearson edges, between absolute values to independent values
- Chnage the range of visible Pearson edges, based on their value.
Editor menu

Here a brief description of each button in the editor menu:
- Show/Hide Edge Label Show/hide the value of connections between nodes (weight of edges)
- Change node name Change the label used to identify each node in the editor
- Change layout Rearrange the nodes positions in the editor according to the selected layout
- Center graph Center the grahp in the middle of the editor area
- Fit graph Zoom the graph so it's fully visible insde the editor area
- Zoom wheel Toggle the ability to automatically zoom with the mouse wheel.
- Active: Enable the editor to zoom in/out with the mouse wheel
- Inactive: Zooming in/out with the mouse wheel is enable only while pressing the "Ctrl" key on the keyboard
- Export Export the network in multiple formats:
- Cytoscape (json) This file can be imported in cytoscape desktop. Contains all edges and nodes.
- Cytoscape WYS (json) This file can be imported in cytoscape desktop. Contains only visible edges and nodes.
- Excel (csv) This file can be imported in excel and contains the list of all ongene connections whit the associated OneGenE/Pearson values
- Excel WYS (csv) Same as previous entry, but only for visible connections
- Image (png) Export the grahp as an image
- Vector image (svg) Export the grahp as a verctorial image
- Legend and Short How-to Pop ups a summary of all the options described here
Editor elements
Genes (Nodes)
OneGenE RF association (Edge)
OneGenE Relative Frequence association (edge) has an arrow to show the direction.
Pearson correlation (Edge)
Pearson correlation can be green (>=0) or red (<0). The shade is related to the value. The lower the absolute value, the lighter the color.
Editor interactions
- You can move the genes (nodes) and you can zoom in and zoom out.
- With hover action on a node, the node itself and the directly connected nodes (alongside with connection edges) are highlighted.
- Right click of the mouse on a gene (node) opens a contextual menu that allows you
- delete the gene (node); this action cannot be undone
- you can highlight as on hover, and the highlight is kept on mouse out of the node;
- marks/unmarks the node as seed (it does not rebuild the network);