

The following example is done using the following data
Genes identifier
Gene1, Gene2, Gene3, Gene4, Gene5
OneGene Relative Frequency associations are shown in the following table.
| From | To | Value |
|---|---|---|
| Gene1 | Gene2 | 0.93 |
| Gene1 | Gene3 | 0.95 |
| Gene1 | Gene4 | 0.93 |
| Gene1 | Gene5 | 0.93 |
| Gene2 | Gene1 | 0.98 |
| Gene2 | Gene5 | 0.42 |
| Gene3 | Gene1 | 0.99 |
| Gene3 | Gene4 | 0.92 |
| Gene4 | Gene5 | 0.91 |
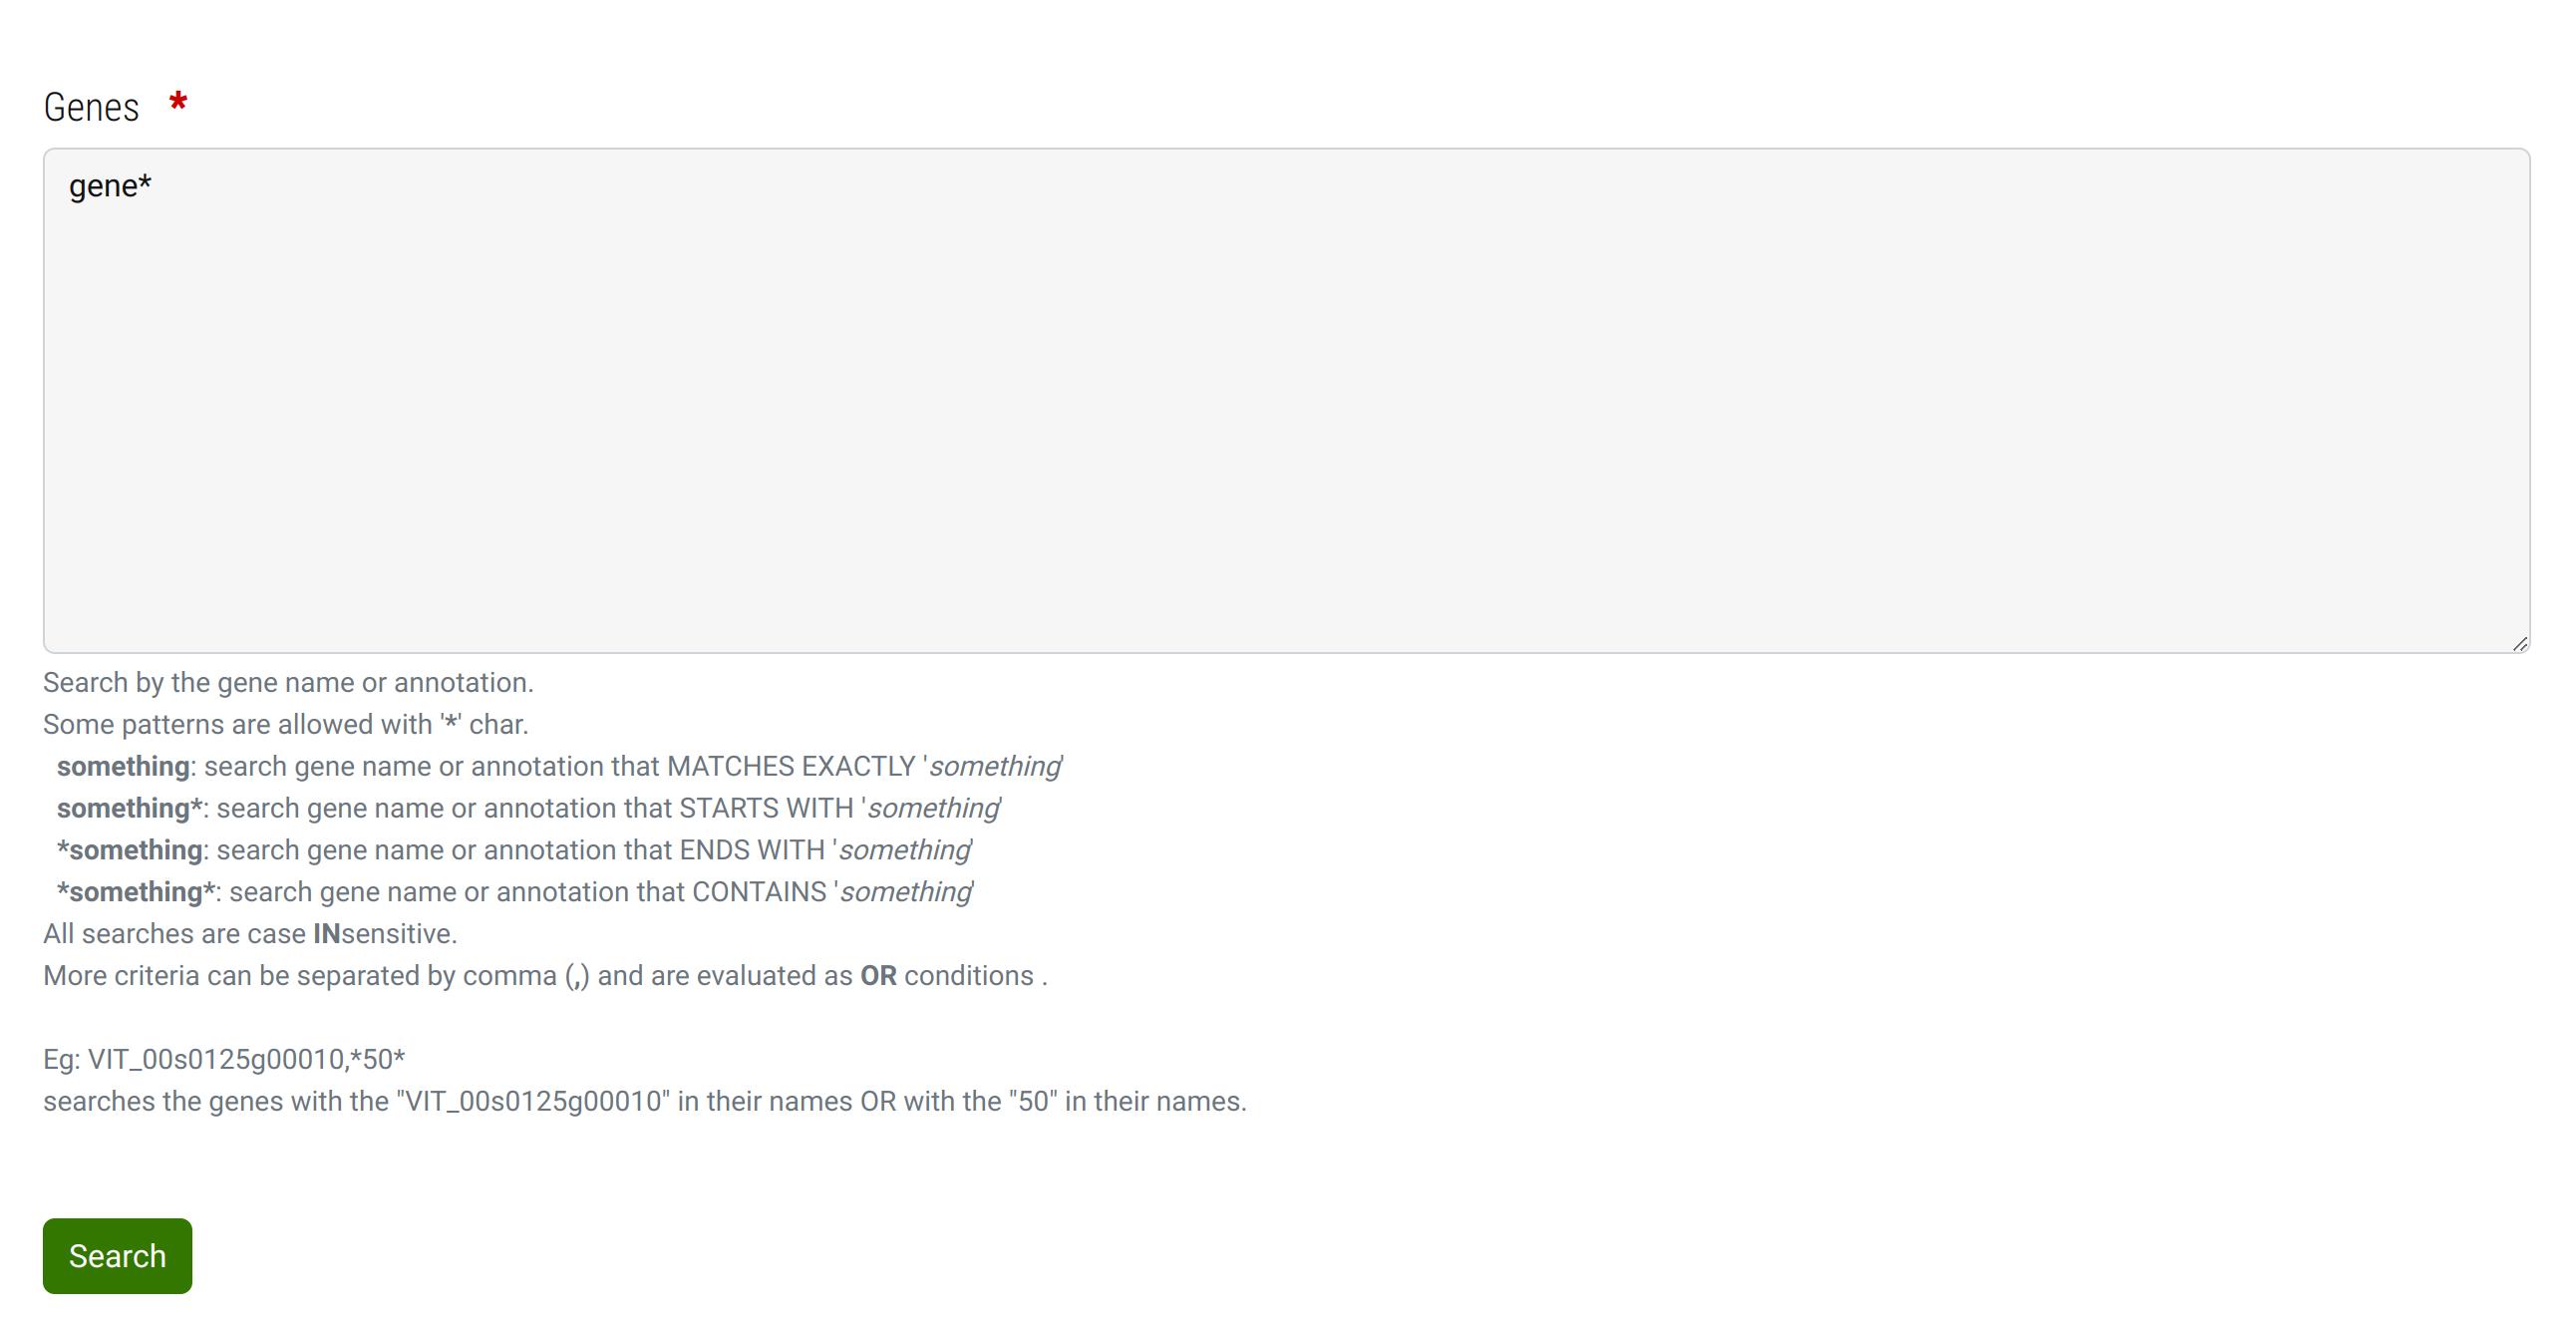
Step 1
You search Genes whose “identifier” STARTS WITH “gene”.
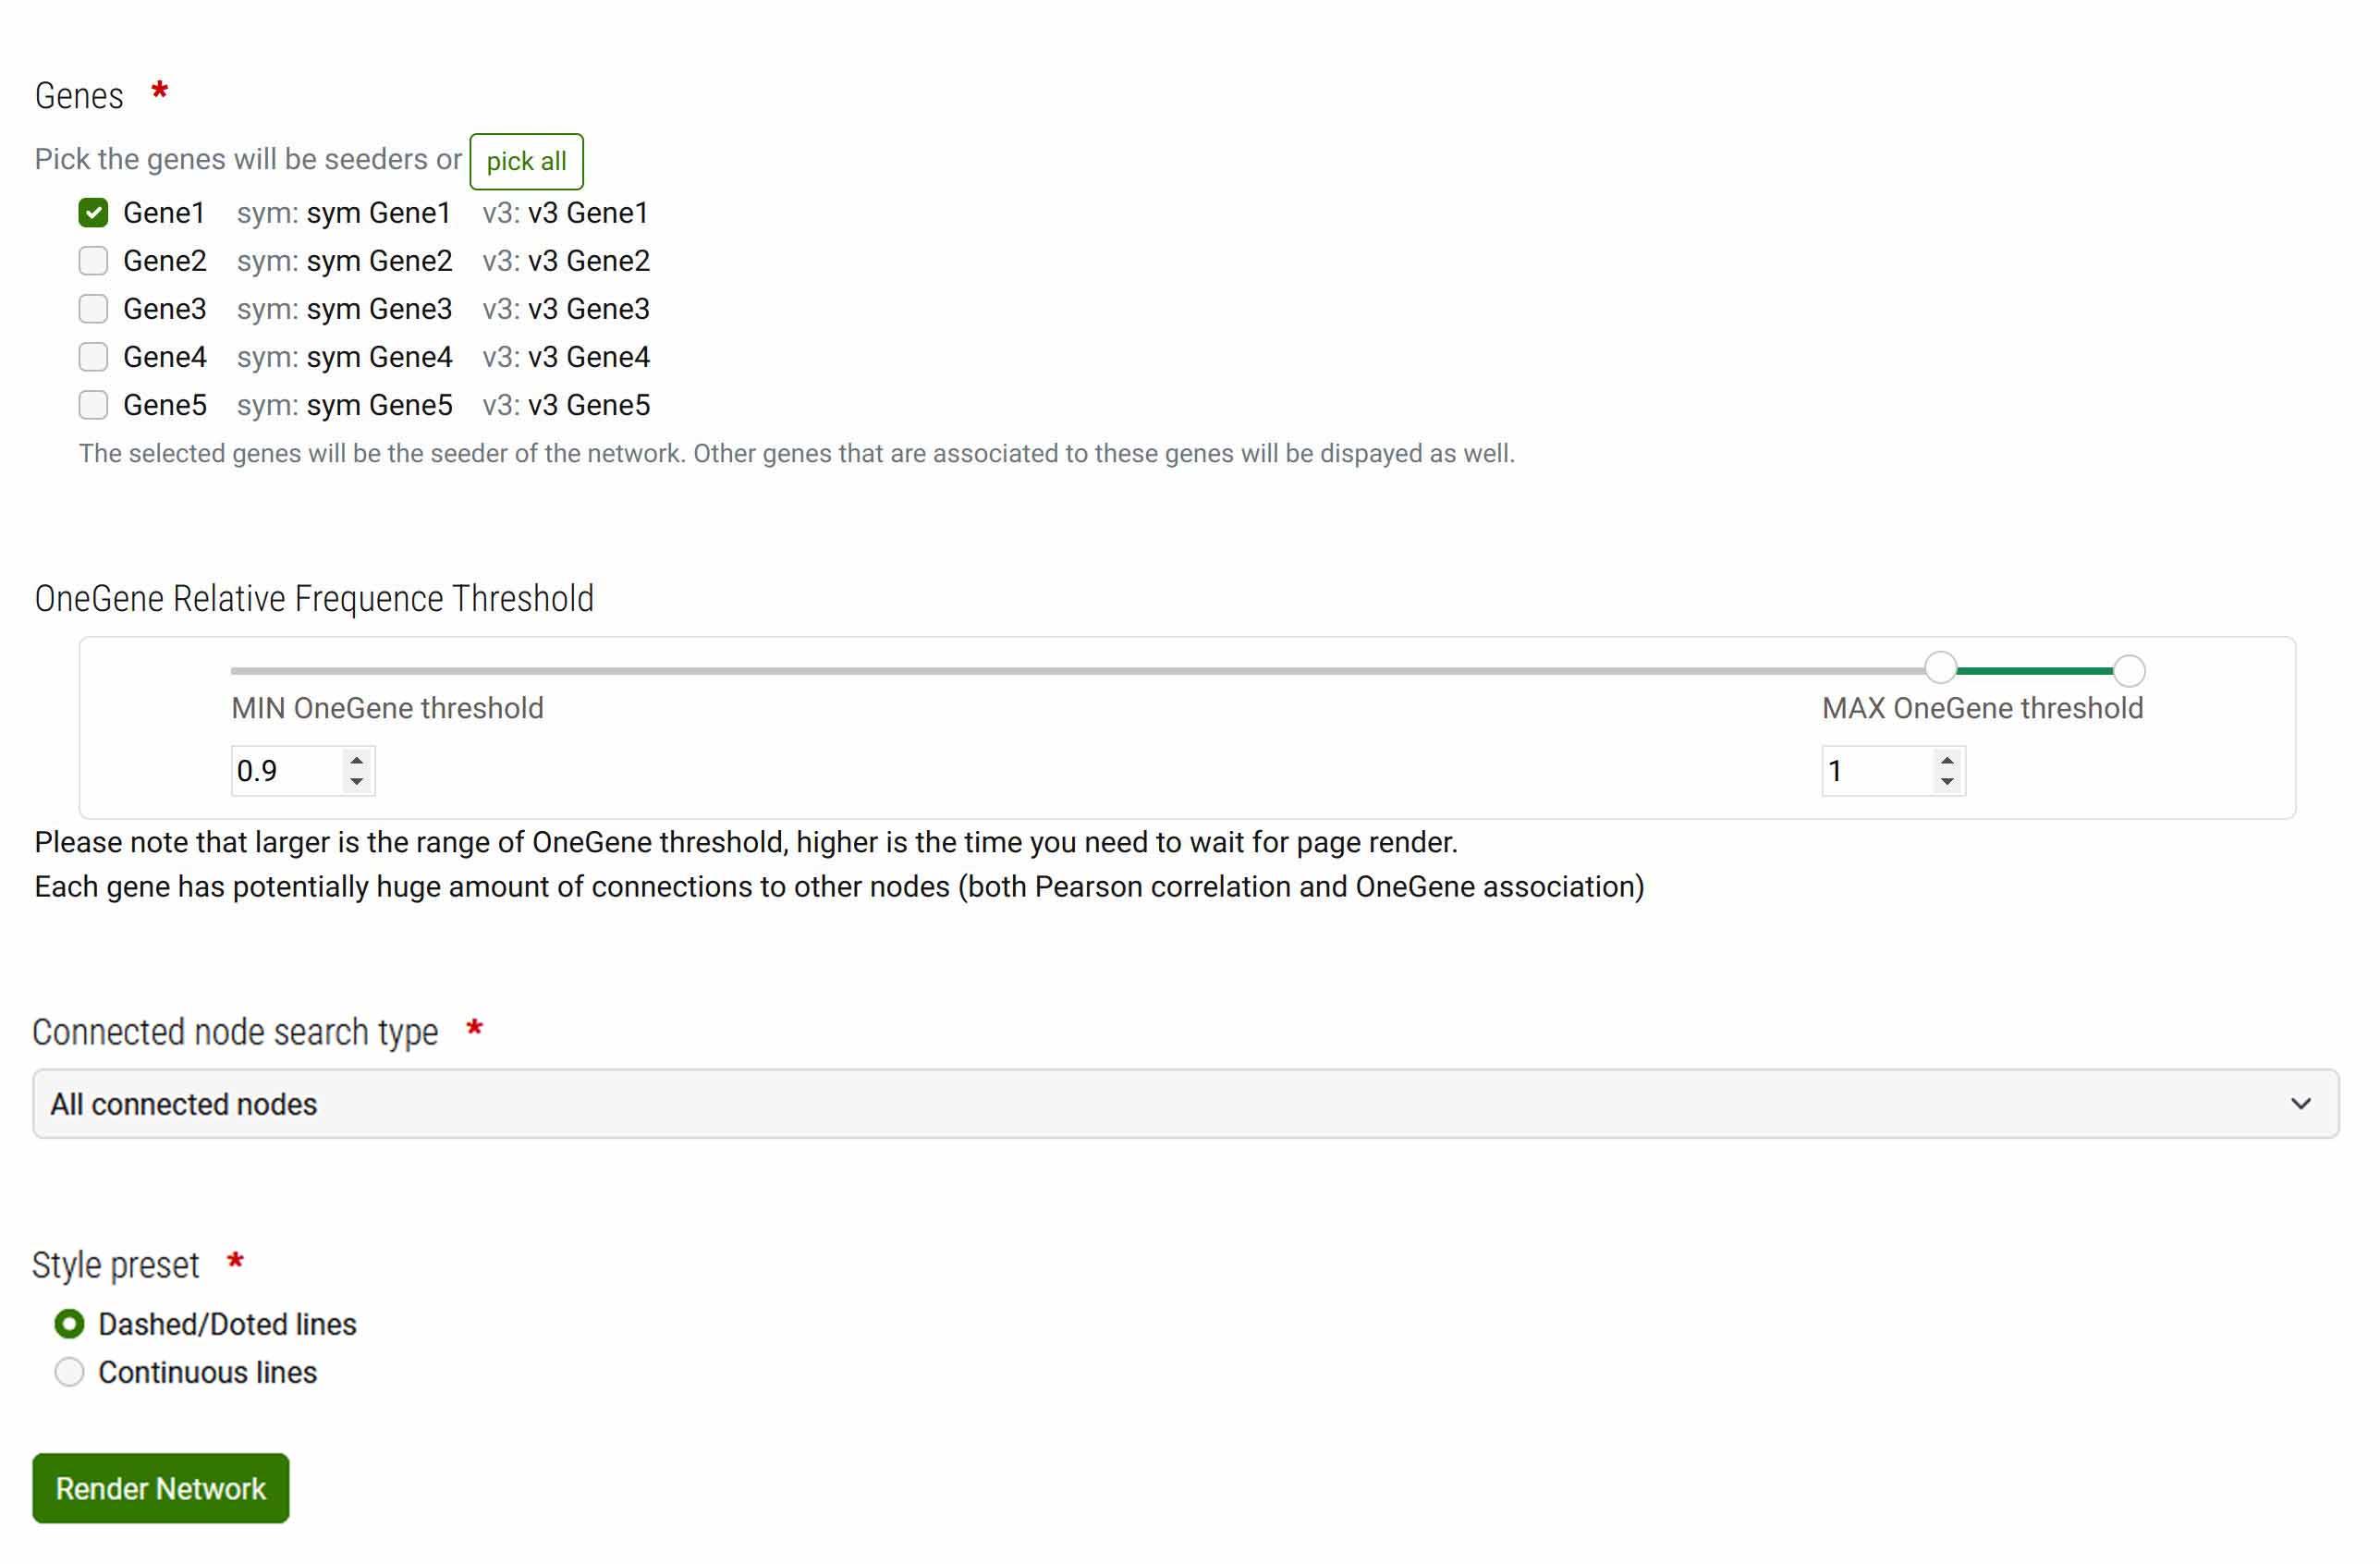
Step 2
You pick the “Gene1” as seeder. You set the range between 0.90 and 1.00
Step 3
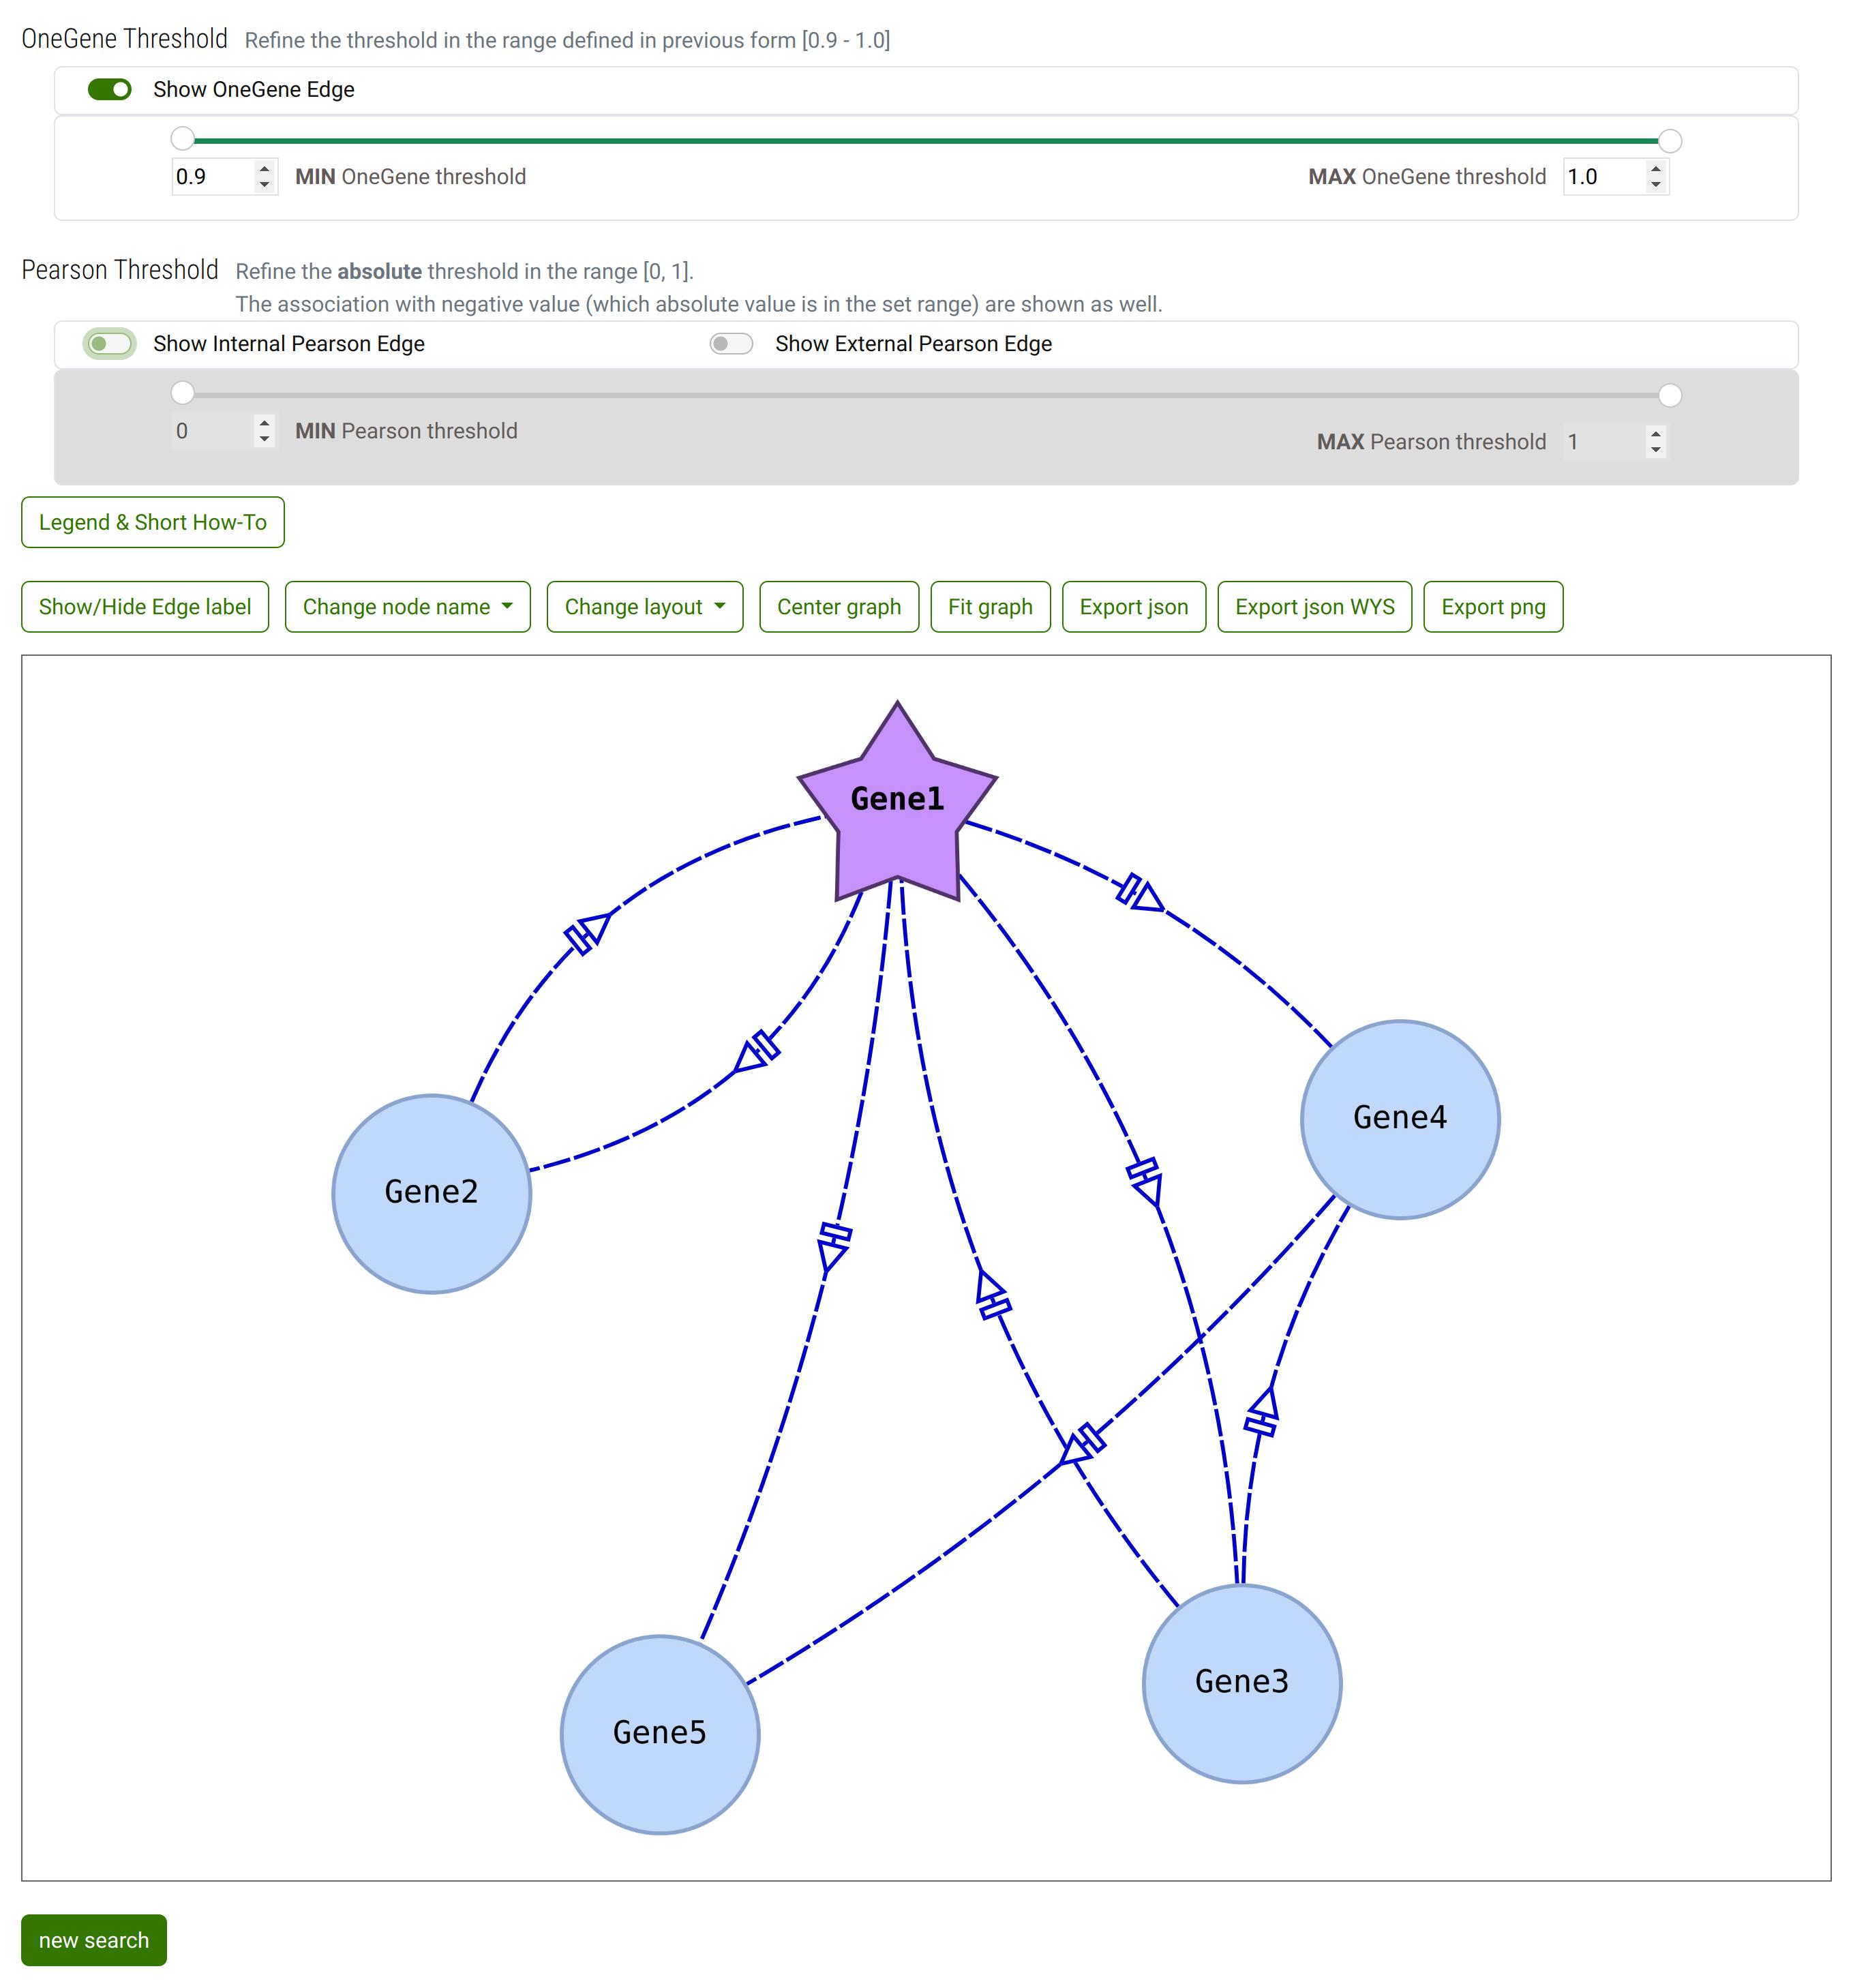
The resulting network.
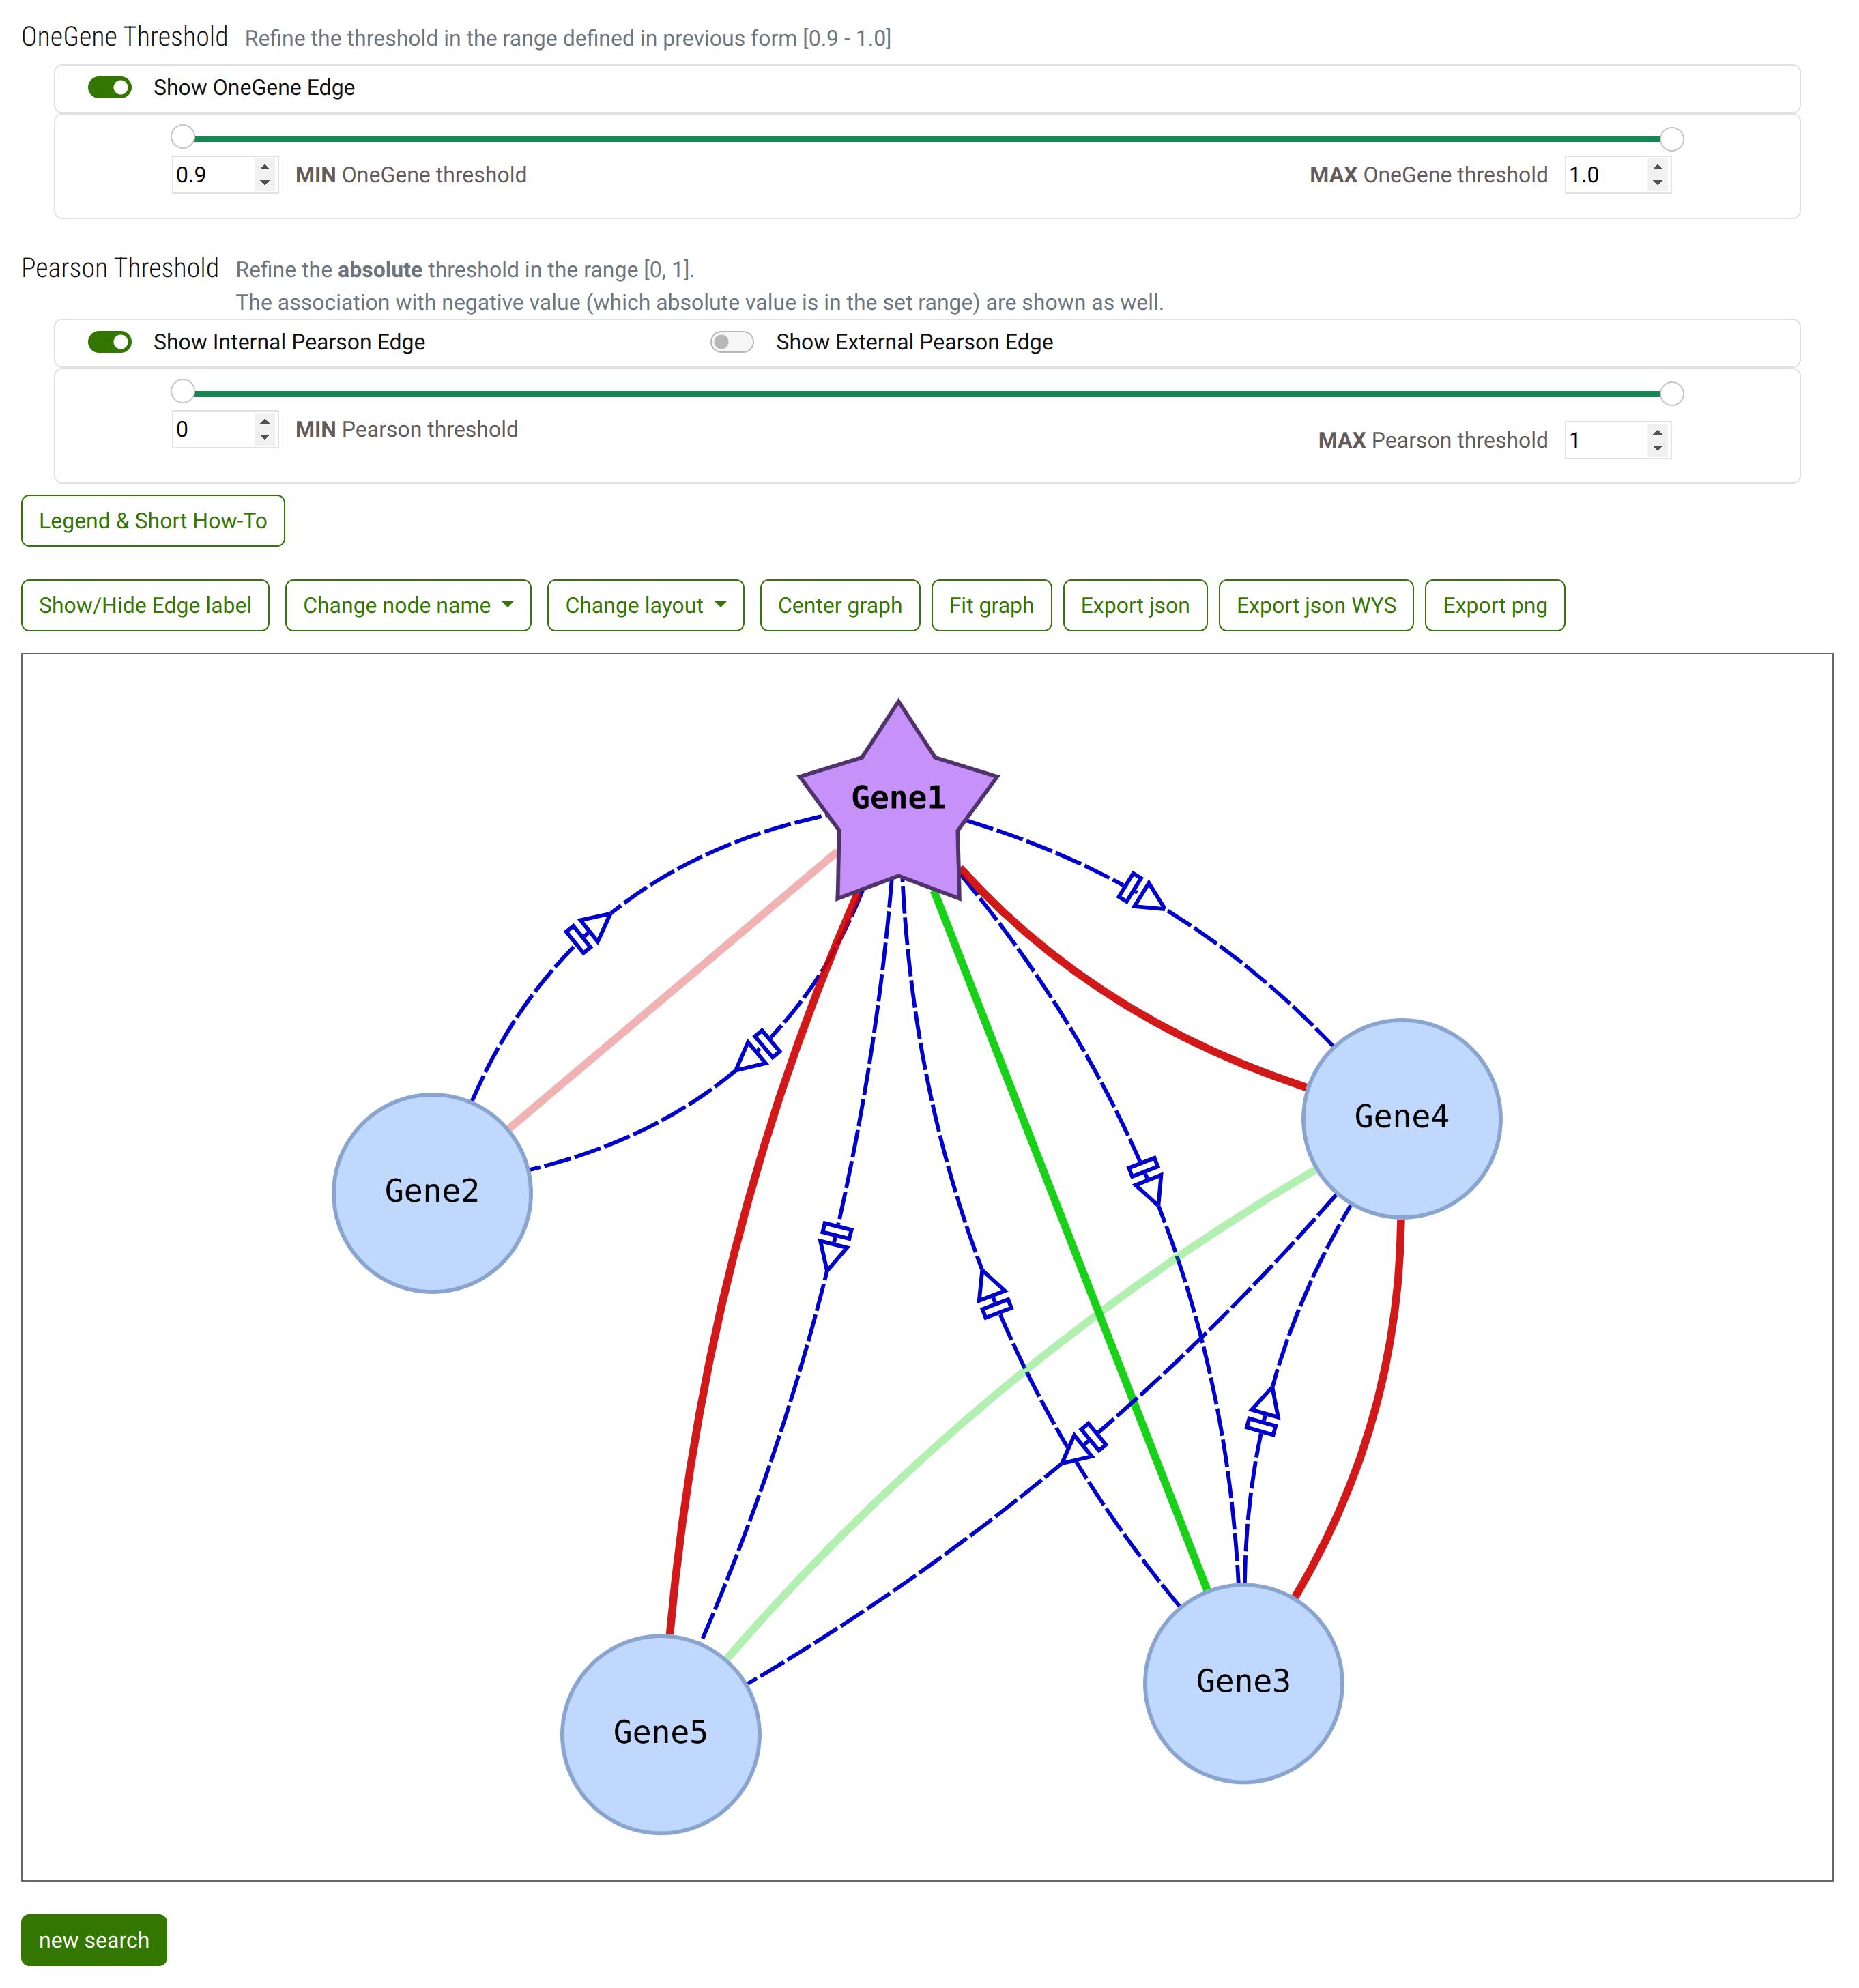
Default setup: the External Pearson correlation are hidden. The other edges (Pearson Internal correlationa and OneGenE Relative Frequency) are shown.
If you compare the network with the list of OneGeneE, the OneGenE Relative frequency between Gene2 and Gene5 is not shown since its value is outside the selected range in step 2.
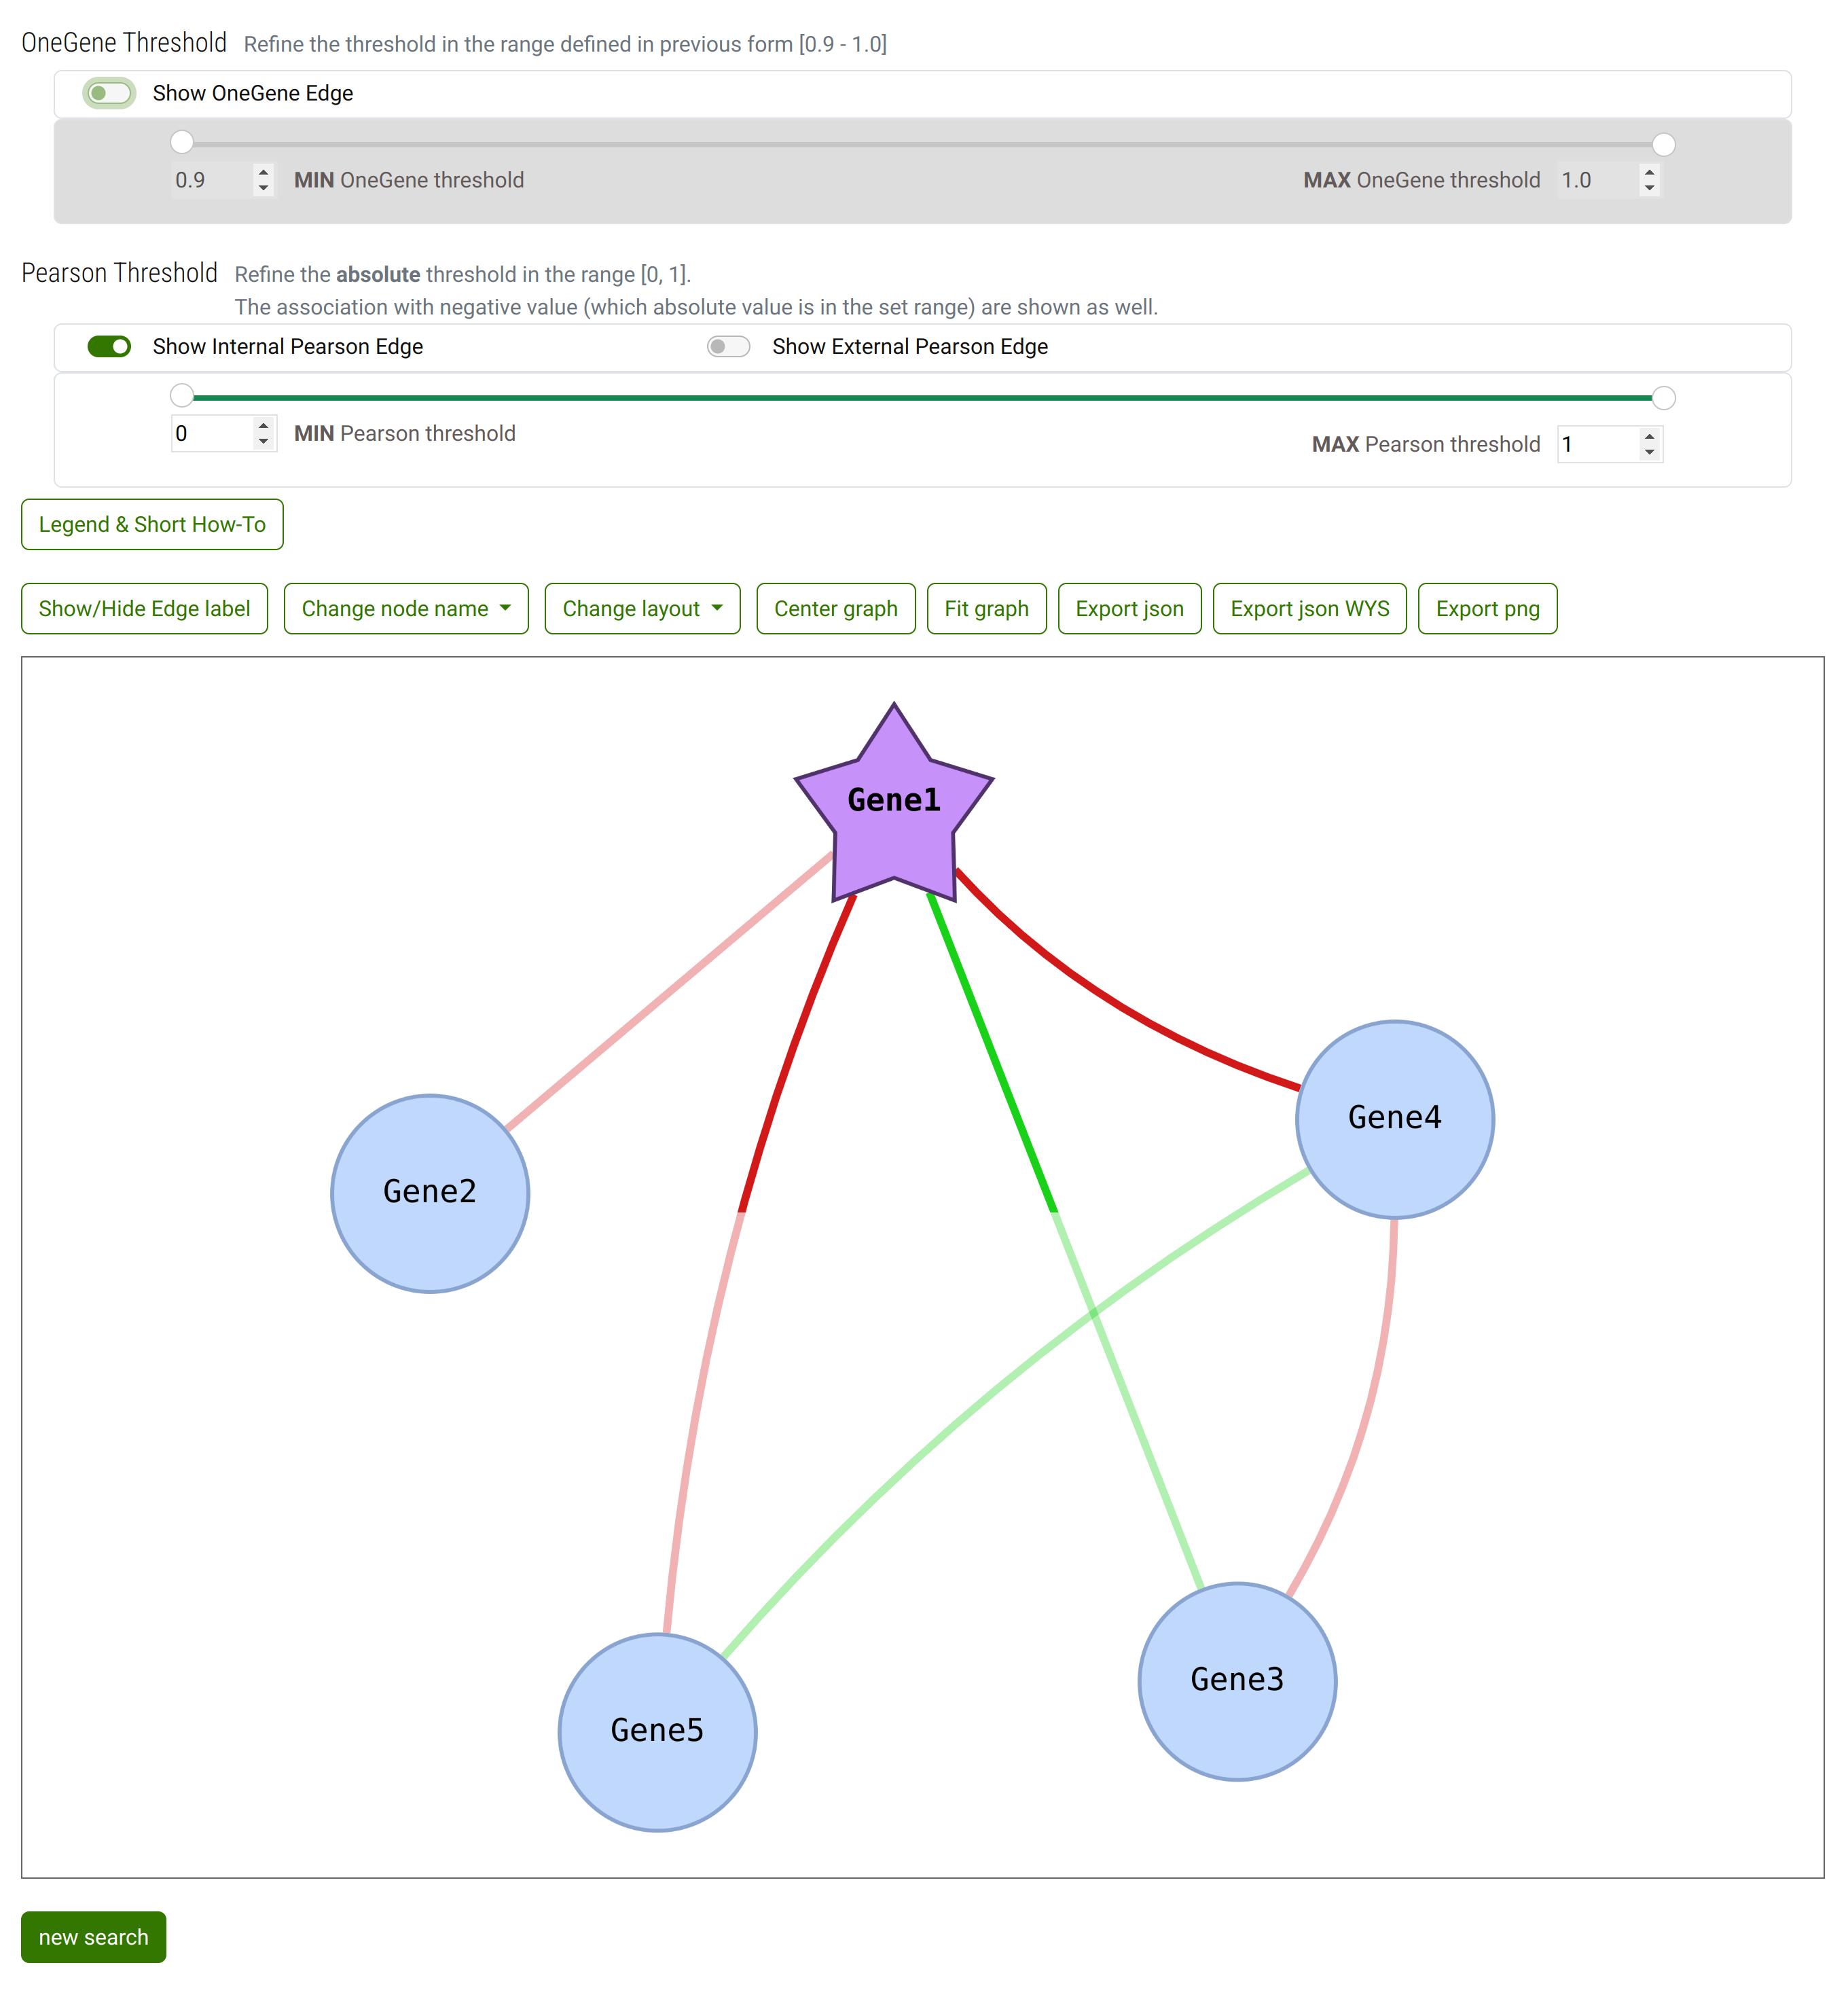
Result of some interaction with controls and canva
When OneGenE Relative Frequency association is hidden.
When Pearson correlations are hidden (both internal and external)
When you change ranges
OneGeneE threshold min from 0.9 to 0.96
Pearson threshold max from 1 to 0.52
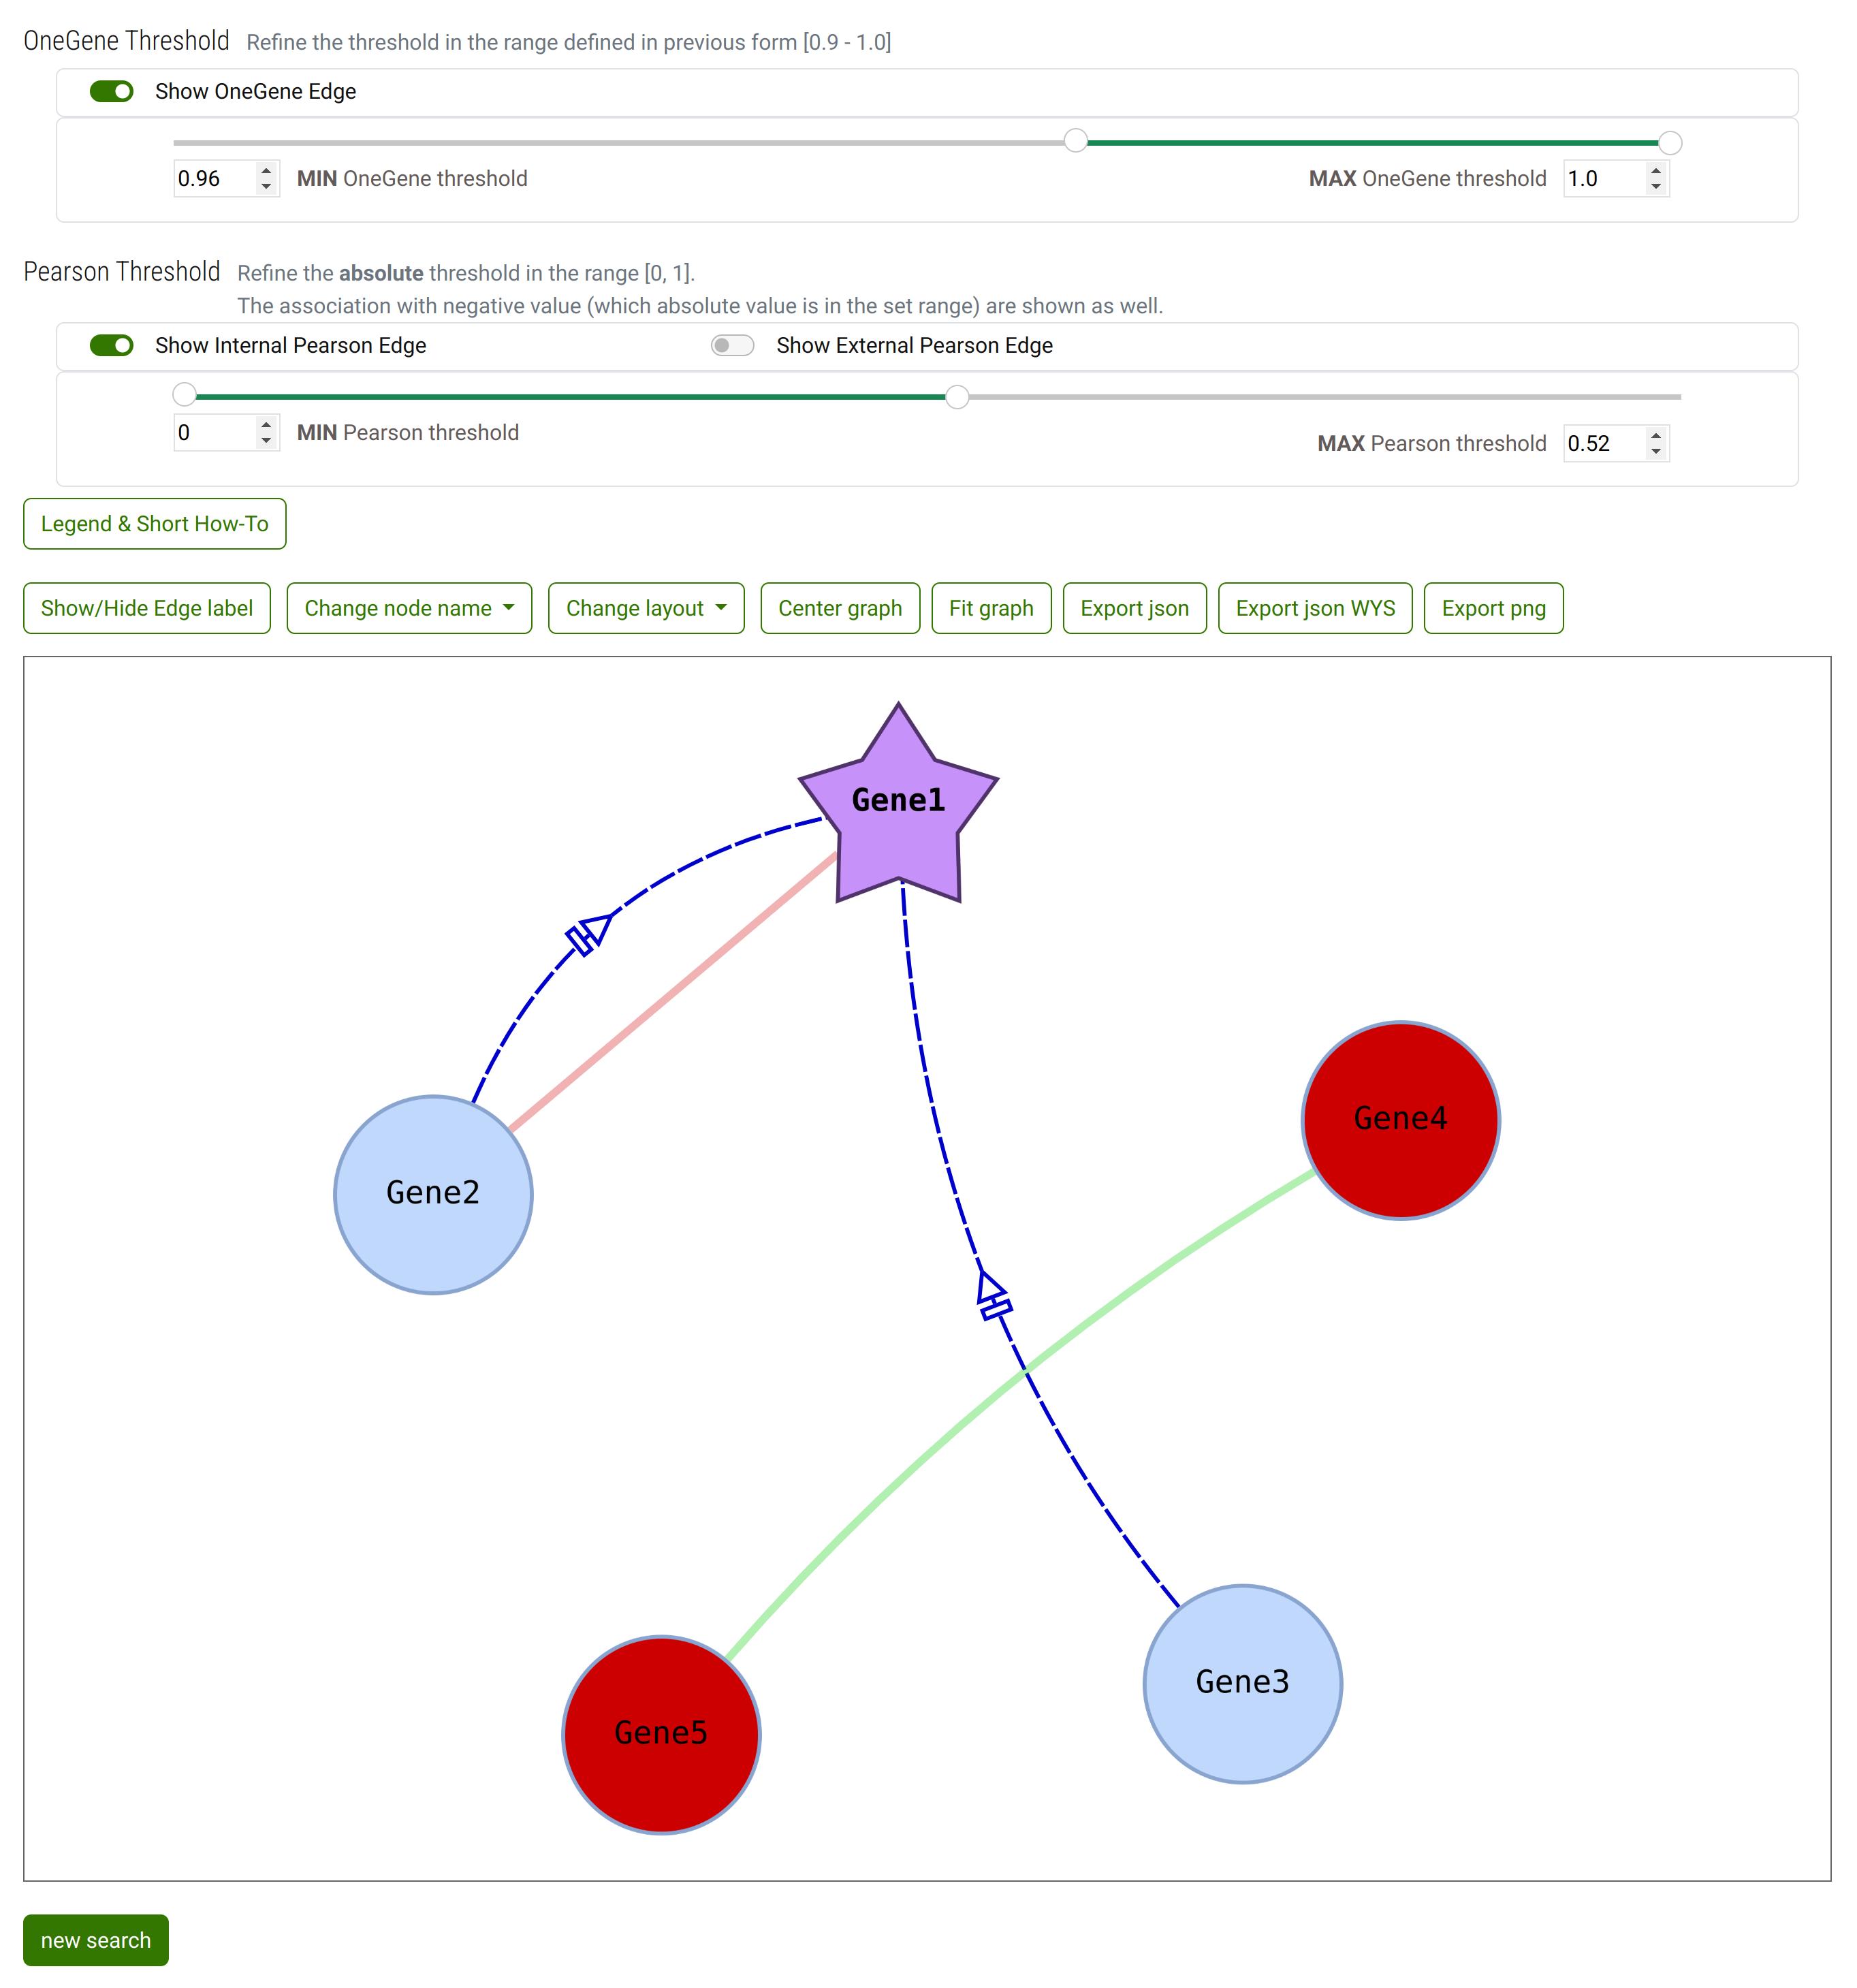
Some genes are colored as red: the color highlights that the genes are connected with NO OneGene Relative Frequency association to any other Gene. The condition is raised by the change of thresholds.